
Population bottlenecks represent one of the most critical concepts in conservation biology and evolutionary genetics, with far-reaching implications for species survival. These events occur when a population undergoes a drastic reduction in size, often due to environmental catastrophes, human activities, or disease outbreaks.
The consequences can be severe, leading to diminished genetic diversity, increased inbreeding, and heightened extinction risk. Understanding how to calculate the probability of bottleneck survivors is not just an academic exercise—it’s a vital tool for predicting species resilience and informing conservation strategies.
In nature, population bottlenecks have shaped the genetic makeup of many species we see today. From the near-extinction of the northern elephant seal in the 19th century to the genetic uniformity observed in cheetahs, these events leave lasting marks on populations. Scientists and researchers rely on precise calculations to determine survival probabilities, which help assess whether a species can recover or faces imminent collapse.
This involves analyzing factors such as initial population size, reproductive rates, and genetic variability, all of which influence a population’s ability to rebound.
The process of calculating bottleneck survival probability combines mathematical modeling with biological principles. Simple formulas, such as the ratio of surviving individuals to the original population, provide a baseline estimate. However, more advanced methods incorporate effective population size (Ne) and genetic drift to account for real-world complexities.
Tools like the Bottleneck Calculator Tools streamline these calculations, offering conservationists and geneticists reliable data for decision-making.
This guide will explore the step-by-step methods for determining bottleneck survival rates, examine real-world case studies, and highlight common pitfalls in these calculations. Whether you’re a student, researcher, or conservationist, mastering these techniques is essential for safeguarding biodiversity in an era of rapid ecological change.
Let’s dive into the science behind how to calculate the probability of bottleneck survivors and its critical role in preserving vulnerable species.
What Is a Bottleneck Event?
A population bottleneck occurs when a population’s size is sharply reduced for at least one generation. This reduction decreases genetic variation and can significantly affect evolutionary outcomes.
Common causes of bottlenecks include:
- Natural disasters (e.g., earthquakes, floods)
- Epidemics
- Overhunting or habitat loss
- Founder effects during migration
Once the bottleneck passes, the surviving individuals reproduce, but the new population may lack the genetic diversity of the original.
Why Calculating Bottleneck Survival Probability Matters
Understanding how to calculate probability of bottleneck survivors is critical in:
Applications in Different Fields
- Conservation Biology: Helps save endangered species.
- Evolutionary Genetics: Explains how species adapt after near-extinction.
- Epidemiology: Models disease impact on populations.
Real-World Consequences
- Cheetahs: Survived a bottleneck 10,000 years ago, leading to low genetic diversity.
- Northern Elephant Seals: Hunted to ~20 individuals in the 1890s, now recovered but with reduced genetic variation.
Key Factors Affecting Bottleneck Survival Rates
| Factor | Impact |
|---|---|
| Initial Population Size (N₀) | Larger populations have higher survival odds. |
| Bottleneck Severity | Extreme reductions (>90%) risk extinction. |
| Reproductive Rate | Fast-breeding species recover quicker. |
| Genetic Diversity | Low diversity = higher vulnerability to diseases. |
| Environmental Conditions | Post-bottleneck habitat quality matters. |
Core Factors in the Probability Calculation
When modeling the probability of survivor outcomes after a bottleneck, key variables include:
- Initial population size (N₀)
- Post-bottleneck population size (N₁)
- Allele frequencies before the bottleneck
- Random sampling effects (genetic drift)
- Selection pressure (if applicable)
How to Calculate Probability of BottleNeck Survivors
Basic Formula
The simplest way to estimate survival probability:P=N1N0P=N0N1
- N₀ = Initial population size
- N₁ = Post-bottleneck population size
Example Calculation:
If a population drops from 5,000 to 500:P=5005000=0.1P=5000500=0.1
Adjusting for Stochastic Events
- Demographic Stochasticity: Random birth/death fluctuations.
- Genetic Stochasticity: Random allele loss.
Use Monte Carlo simulations for more accurate modeling.
Basic Method: Genetic Drift Simulation
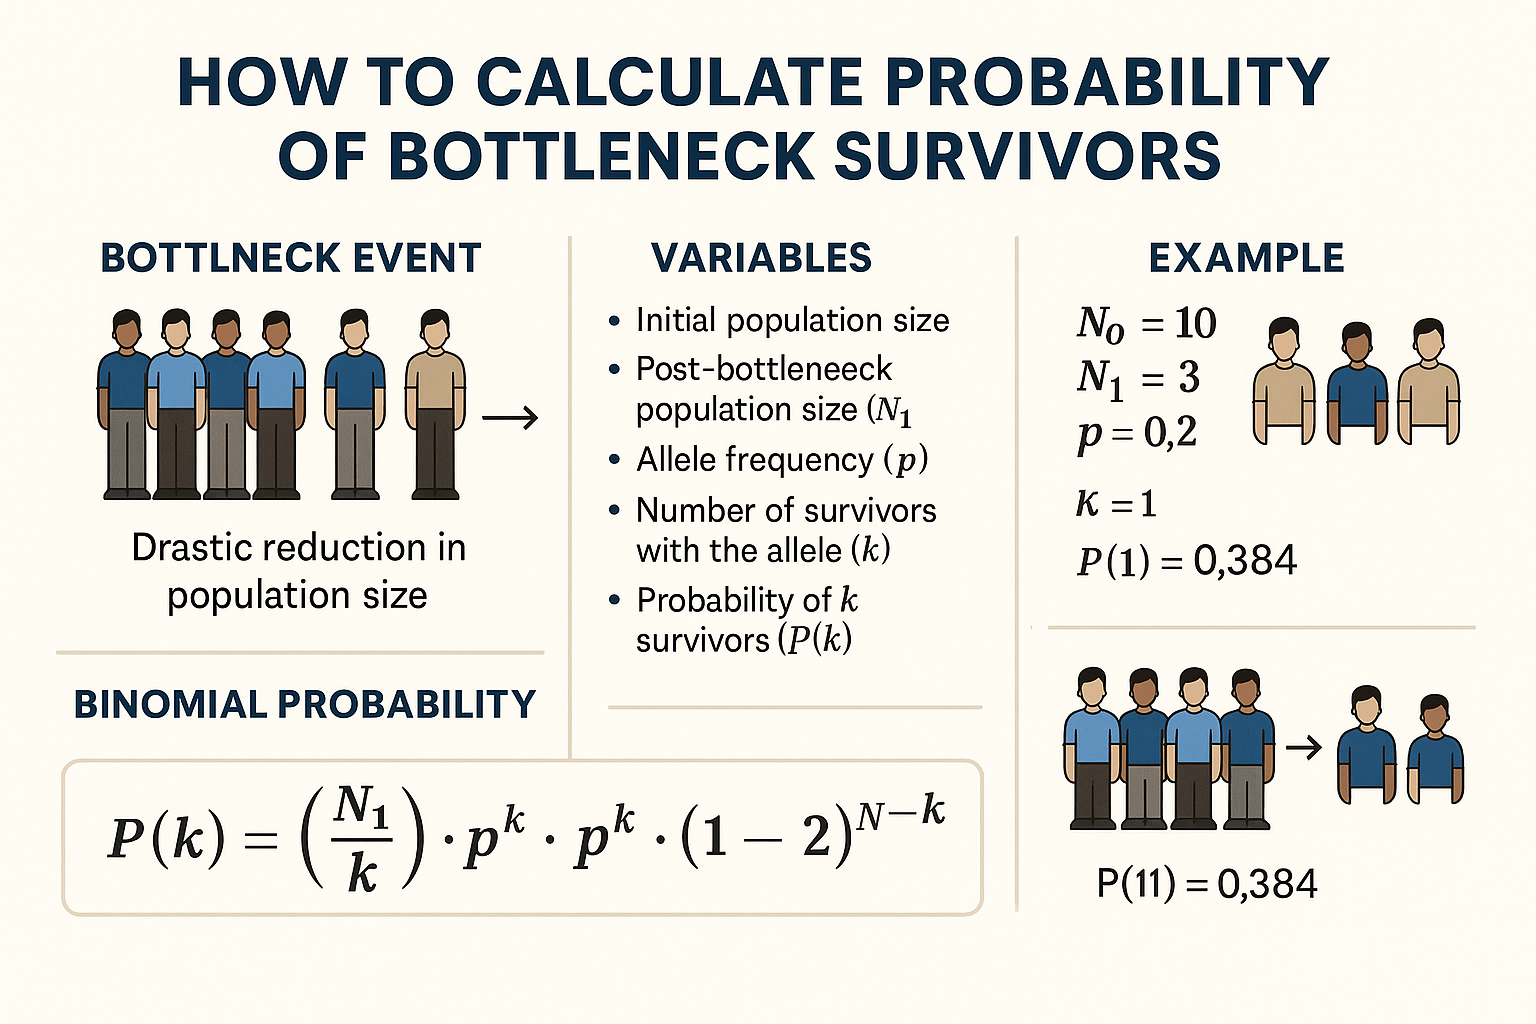
A simplified approach involves binomial or multinomial probability models. For example:
- Assume allele A has frequency p before the bottleneck.
- After the bottleneck, N₁ individuals are randomly sampled.
- The chance that k individuals carry allele A can be calculated using binomial distribution:
P(k)=(N1k)⋅pk⋅(1−p)N1−kP(k) = \binom{N₁}{k} \cdot p^k \cdot (1-p)^{N₁-k}P(k)=(kN1)⋅pk⋅(1−p)N1−k
This is a foundational way to estimate how traits survive purely by chance.
Real-World Example
Let’s say:
- A population of 1,000 individuals experiences a sudden collapse to just 50 survivors.
- A rare allele exists in 10% of the original population.
To estimate the probability that at least one individual with the allele survives, you calculate: P(no survivors with allele)=(1−0.1)50=0.00515P(\text{no survivors with allele}) = (1 – 0.1)^{50} = 0.00515P(no survivors with allele)=(1−0.1)50=0.00515 P(at least one survivor)=1−0.00515=0.99485P(\text{at least one survivor}) = 1 – 0.00515 = 0.99485P(at least one survivor)=1−0.00515=0.99485
So, there’s a 99.5% chance that the allele survives the bottleneck.
Incorporating Genetic Drift and Effective Population Size
Effective Population Size (Ne)
Not all individuals reproduce. Ne accounts for breeding adults:Ne=4×Nm×NfNm+NfNe=Nm+Nf4×Nm×Nf
- Nₘ = Number of breeding males
- N_f = Number of breeding females
Heterozygosity Loss
Measures genetic diversity reduction:Ht=H0(1−12Ne)tHt=H0(1−2Ne1)t
- H₀ = Initial heterozygosity
- Hₜ = Heterozygosity after t generations
Real-World Case Studies of Population Bottlenecks
Case 1: Mauritius Kestrel
- Pre-bottleneck: Hundreds of birds.
- Post-bottleneck (1974): Only 4 individuals left.
- Recovery: Intensive breeding programs saved the species.
Case 2: Humans (Toba Catastrophe Theory)
- Event: Supervolcano ~70,000 years ago.
- Hypothesized bottleneck: Human population may have dropped to 1,000–10,000.
- Genetic evidence: Low diversity in some populations.
Tools to Help You Calculate Faster
While manual calculations can help illustrate the basics, complex bottleneck scenarios often require simulation tools.
For practical applications, check out our Bottleneck Calculator Tool, designed to help researchers and enthusiasts model genetic survival probabilities under various bottleneck conditions.
Tools and Software for Bottleneck Analysis
| Tool | Use Case | Link |
|---|---|---|
| Bottleneck Calculator Tools | Quick survival probability estimates | Visit Tool |
| BOTTLENECK (Software) | Detects recent bottlenecks from genetic data | Download Here |
| NeEstimator | Calculates effective population size | Access Here |
Who Should Use These Models?
- Geneticists looking to model allele transmission
- Conservationists estimating the viability of endangered populations
- Data scientists building population simulations
- Students learning about genetic drift and probability theory
To learn more about our mission and scientific approach, visit our About Us page.
Common Mistakes in Bottleneck Probability Calculations
❌ Ignoring Ne: Using total population instead of breeding adults.
❌ Overlooking Genetic Drift: Assuming survival = recovery.
❌ Extrapolating Short-Term Data: Bottlenecks have long-term effects.
Conclusion
Understanding how to calculate the probability of bottleneck survivors is more than just a theoretical exercise—it’s an essential practice with real-world implications for species preservation and ecosystem stability. As human activities and environmental changes continue to threaten biodiversity, the ability to predict population resilience through bottleneck analysis becomes increasingly vital. The methods discussed in this guide, from basic survival rate formulas to advanced genetic drift modeling, provide scientists and conservationists with the tools needed to assess extinction risks and implement effective recovery strategies.
The consequences of population bottlenecks extend far beyond immediate survival rates. Reduced genetic diversity can leave species vulnerable to diseases, climate shifts, and other ecological pressures for generations. Case studies like the Mauritius kestrel and the northern elephant seal demonstrate both the devastating impacts of bottlenecks and the potential for recovery through targeted conservation efforts. However, these successes often require early intervention, accurate data, and a deep understanding of population dynamics—all of which hinge on precise bottleneck probability calculations.
Advanced tools, such as the Bottleneck Calculator Tools, have revolutionized this field by automating complex analyses and minimizing human error. Yet, even with technological advancements, challenges remain. Common mistakes—like overlooking effective population size or underestimating long-term genetic consequences—can skew results and lead to flawed conservation plans. This underscores the need for continuous education, rigorous methodology, and collaboration across scientific disciplines.
Looking ahead, the integration of bottleneck analysis with emerging technologies—such as AI-driven population modeling and real-time genetic monitoring—promises to enhance our predictive capabilities. These innovations could enable faster, more accurate assessments of at-risk species, allowing for proactive rather than reactive conservation measures. Furthermore, public awareness and policy support are crucial in addressing the root causes of population declines, from habitat destruction to climate change.
In summary, mastering how to calculate the probability of bottleneck survivors equips us with a powerful tool to combat biodiversity loss. By combining scientific rigor with practical conservation strategies, we can mitigate the impacts of population crashes and foster healthier, more resilient ecosystems. Whether you’re a researcher, student, or environmental advocate, applying these principles contributes to a broader effort to protect our planet’s irreplaceable wildlife. For further insights and resources, explore Bottleneck Calculator Tools and join the global mission to safeguard endangered species for future generations.
FAQs
Q1: What defines a population bottleneck?
A population bottleneck occurs when a species’ population size drops drastically due to environmental disasters, disease, or human activity. This sharp reduction leads to significant loss of genetic diversity as only a fraction of the original population survives. The event can have long-lasting effects on the species’ evolutionary potential.
Q2: Why is calculating bottleneck survival probability important?
It helps conservationists assess extinction risks and develop effective recovery plans for endangered species. Understanding survival probabilities informs breeding programs and habitat protection strategies. Accurate calculations prevent underestimating resources needed for population restoration.
Q3: What’s the basic formula for survival probability?
The simplest calculation is P = N₁/N₀, where N₀ is initial population and N₁ is survivors. For example, if 1,000 becomes 100, survival probability is 10%. This provides a starting point before more complex analyses.
Q4: How does effective population size differ from actual count?
Effective population size (Ne) counts only breeding individuals, not total population. It’s typically smaller due to unequal reproduction rates. Ne determines genetic diversity maintenance, making it crucial for conservation assessments.
Q5: What role does genetic drift play in bottlenecks?
Genetic drift becomes stronger in small populations, randomly altering gene frequencies. This can eliminate beneficial traits or fix harmful mutations. The effects persist long after the bottleneck event.
Q6: Can species fully recover from severe bottlenecks?
Some species like northern elephant seals have numerically recovered from extreme bottlenecks. However, they often retain reduced genetic diversity that may limit future adaptability. Complete genetic recovery can take thousands of generations.
Q7: What tools analyze bottleneck effects?
Scientists use software like BOTTLENECK and NeEstimator for genetic analysis. The Bottleneck Calculator Tools provide survival probability estimates. Advanced modeling uses programs like SLiM for long-term predictions.
Q8: What are common calculation mistakes?
Using total population instead of Ne overestimates genetic health. Ignoring generational impacts leads to incomplete assessments. Assuming stable environments when planning recovery is another frequent error.
Q9: How long for genetic diversity recovery?
Severe bottlenecks may require thousands of generations for natural diversity restoration. Larger populations recover faster through retained variation or migration. Conservation programs can accelerate this through managed breeding.
Q10: What’s the 50/500 rule?
Franklin’s rule suggests 50 individuals prevent inbreeding depression short-term. 500 individuals are needed for long-term evolutionary potential. These benchmarks guide minimum viable population targets.
Q11: How do bottlenecks affect disease resistance?
Reduced genetic diversity limits immune system variability. Bottlenecked populations become more vulnerable to pathogens. This was seen in Tasmanian devils suffering from contagious cancers.
Q12: Can humans experience population bottlenecks?
The Toba catastrophe theory suggests humans may have bottlenecked to 1,000-10,000 individuals about 70,000 years ago. Some genetic evidence supports reduced diversity during this period. Modern isolated populations can also experience bottleneck effects.